|
Strained System
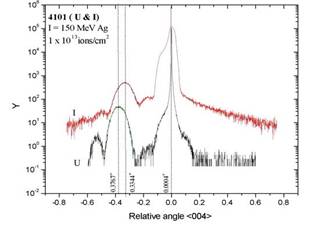
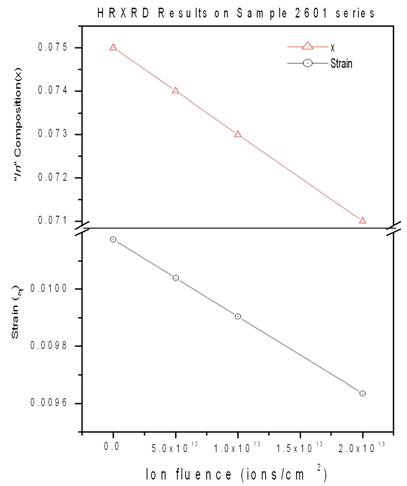
HRXRD Here we present the results of our ion beam mixing experiments on single layer samples. The strain analysis of these samples has been performed with HRXRD at SSPL, Delhi and RBS/C at Alabama. The XRD data has been fitted using MADMAX simulation software. The measured values of thicknesses and compositions were observed different from the nominal values as shown in table 1 and Fig 1 shows the HRXRD spectra of 4101U and 4101I. It shows a clear shift in layer peak which directly indicates the decrease in compressive strain. The broadening in the substrate region indicates the damage in the substrate material which can be annealed out. This is in fact the implantation damage at the end of the energetic particle range (~13m). For the sample 2601 which is irradiated by different fluences, it is observed that the strain is decreasing with the increase in ion fluence Fig 2. shows the plots of the In composition as a function of Ion fluence. It shows that the In composition decreases linearly with the increase in ion fluence. It is due to the fact that the increase in ion beam irradiation will lead to excess diffusion of In into the substrate region. Fig 2. shows the plot of the strain (compressive) vs. the ion fluence. It is shown that the strain is modified during the ion irradiation and is decreasing with the increase in ion fluence. Hence it implies that the strain can be tuned using high energetic ion irradiation with out destroying the quality of the material. Table 1: HRXRD Measurements
Fig 1: HRXRD spectrum of samples 4101U and 4101I
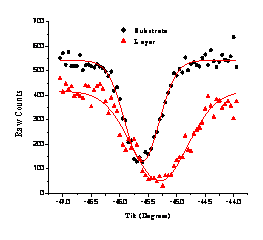
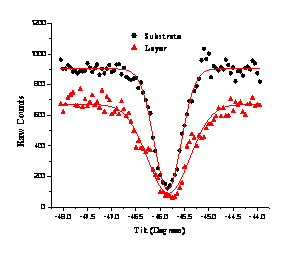
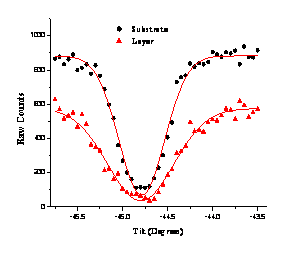
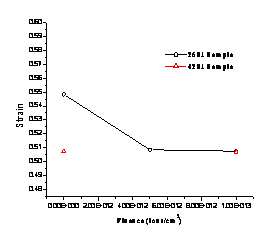
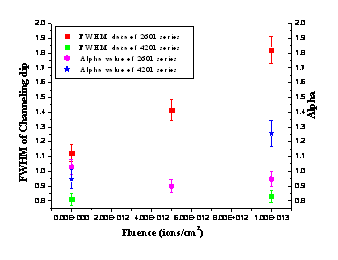
Fig 2: Indium content and lattice strain of 2601 as a function of ion fluence. RBS/C Samples were studied by ion channeling to measure the strain. It is assumed that the in-plane lattice parameter (a||) of the layer within the experimental error is nearly equal to the substrate lattice parameter (as). Figs.3 – 5 show the channeling angular scans of the samples. Reasonable reduction in the yield indicates good crystalline and interface quality in both unirradiated and irradiated samples. Strain and other elastic parameters calculated from these angular scans are summarized in Table – 2. The fluence dependence of strain in these samples (Fig.6) shows a linear dependence, representing a reduction in the compressive strain with incident ion fluence. This reduction of compressive strain in the layer may be due to the diffusion of ‘In’ across the interface. The fluence dependence shows that the mixing effect increases with the increase in ion fluence. This behavior is observed in the HRXRD results also as reported earlier, where the layer peak shifts towards the substrate peak when compared to the unirradiated sample indicating the reduction in compressive strain. Also the reduction of the layer peak intensity of XRD was attributed to the inter-diffusion of ‘Indium’. Low strain values measured from channeling when compared with XRD may be due to the possible errors in depth profiling of RBS spectra. Especially in this case the layer thickness are very low (100 and 250 Ǻ). The effective thickness has been calculated considering the sample tilt (450 for this case of <110> direction) for depth profiling as usual, the angular scans obtained from substrate and layers are too close and hence the measured strain values are low. Alpha value for III-V semiconductors is close to unity. If on the contrary the conservation of the <111> inter-atomic spacing is assumed then a turns out to be close to 2. Here the alpha values have been calculated using the indium composition from XRD results for both unirradiated and irradiated samples. From Table 2 and Fig.7 it is clear that the value of a is around 1 and not 2. The average value of a turns out to be a = 1.031 which is comparable to the Poisson value aP = 0.9139 corresponding to the composition and the constants C11 and C12 of the sample computed by linear interpolation of the elastic constants of GaAs and InAs. The variation of layer dip FWHM of the channeling angular scans with incident ion fluence is calculated and given in Table.1 (also in Fig.7). Increase of this FWHM with irradiation suggest some structural changes in the epilayer caused by SHIs and it is also consistent with the reduction in compressive strain. Increase of channeling dip FWHM in thick film is more when compared with the thin film. This indicates that the irradiation effect is more in thick film suggesting that the initial strain energy plays a crucial role so that strain relieving is higher in thicker film. Table.2: Elastic parameters calculated from the experimental data
* HRXRD results ** Results of present ion channeling work.
Figure.3,4: Channeling Angular Scans of Sample 2601U & 4201U(Data Points with Gauss Fits).
Figure.5: Channeling Angular Scans of Figure.6: Fluence dependence of strain Sample 4201I
(Data Points with Gauss Fits).
measured by ion channeling.
Figure.7: Fluence dependence of FWHM of channeling angular dips and Alpha measured by ion channeling.
|
|||||||||||||||||||||||||||||||||||||||||||||||||||||||||||||||||||||||||||||||||||||||||||||||