|
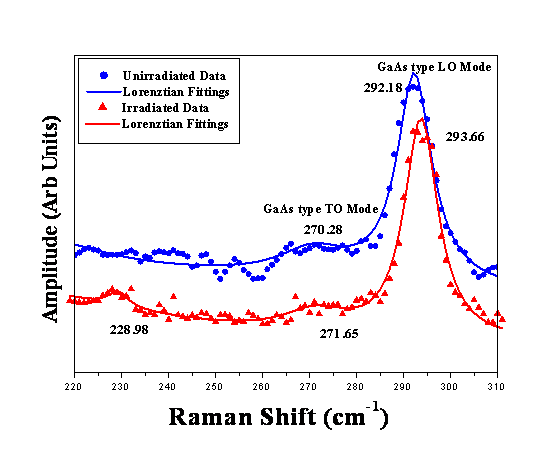
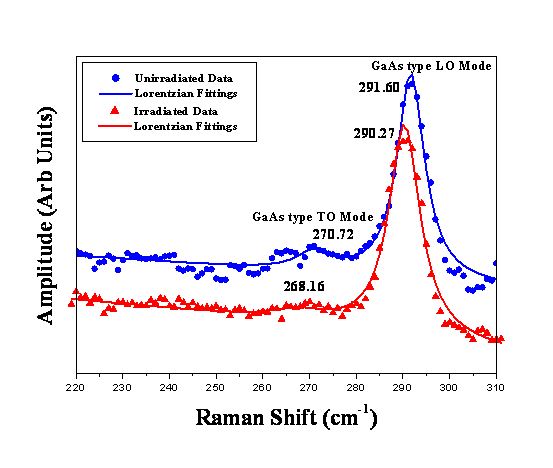
Relaxed samples Raman Spectroscopy: The Raman spectra of 12 and 60 nm thick samples are given in Fig.1&2. GaAs type LO and TO modes are marked in the spectra. InAs type modes are hardly observed which is probably due to less indium concentration. In the present experimental configuration, the GaAs type TO mode is forbidden. However, a weak TO mode at about 270 cm-1 appears in Figs.1&2 due to the strain relaxation in the samples. The usual intense peak of GaAs type LO mode around 290 cm-1 is also observed. The results are discussed in the light of penetration depth of the probe laser beam used in the experiment. The penetration depth of 514.5 nm laser beam in GaAs is about 55nm and in InAs is about 15nm in defect free crystals. These values are significantly reduced by disorder present in the crystal. Hence, in the present study the interface of 12nm and 36nm thick samples are within the penetration depth. However for 60 and 96nm thick samples the interface is beyond the penetration depth of the probe beam. Blue shift for compressive strain (negative ε) is observed. The strain values calculated are given in Table 1. The bulk equivalent (strain free) GaAs type LO mode for In0.18Ga0.82As is taken as 287.54 cm-1 for strain measurements. For the unirradiated samples the blue shift is less for thicker layers (i.e. 60 and 96nm) as compared to the thinner ones. This can be attributed to the reduced strain near the surface as compared to the regions close to the interface. After irradiation, blue shift for thin layers increased and that for the thick layers decreased. This would be probably due to the difference in the ion beam modifications near the interface and near the surface. Additional compressive strain would have been induced in the regions close to the interface on irradiation. But close to the surface, irradiation would have reduced the strain. Beyond a critical layer thickness the strain relaxes giving rise to dislocations, but the relaxation is not abrupt at the critical thickness, as there are various stages of relaxation. Hence beyond critical thickness the strain energy decreases in various stages. The above conjecture about different effects of ion beams at the interface and surface regions suggests that initial strain energy plays a crucial role in such modifications. Table 1 Parameters Measured from the Raman Spectra
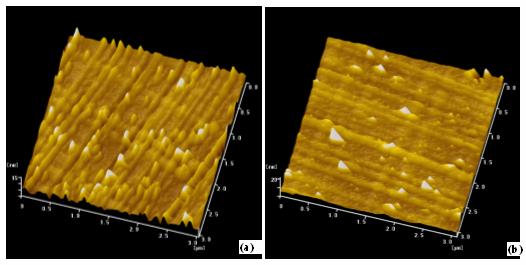
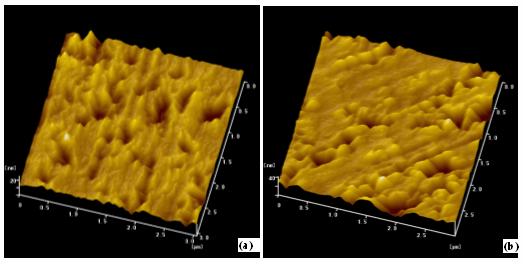
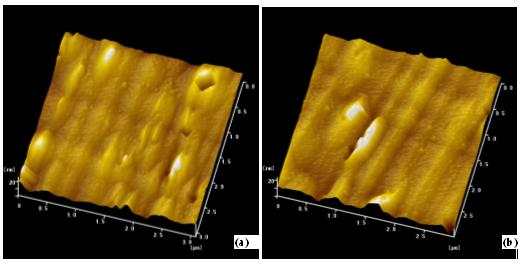
Fig 1 : Raman Spectra of 12nm thick Unirradiated and Irradiated sample. Fig.2: Raman Spectra of 60nm thick Unirradiated and Irradiated Sample AFM The surface morphology of the samples are shown in Fig.3,4 &5. The morphology of 36, 60 and 96nm thick samples are given with 3µm2 area scans for both unirradiated and irradiated samples for comparison. 36 and 96nm thick sample morphologies are similar (though the protrusion densities and size differ) whereas 60 nm thick sample shows different morphology. This would be due to the different strain relaxation regime as a function of layer thickness. Recently similar studies on as grown samples have been reported attributing different morphologies to slow, rapid and saturated regime of strain relaxation. Here the morphologies of 36 and 96 nm thick samples are similar and may be attributed to the same slope of the strain relaxation curve. Periodic lines are observed in the images of 36 & 96nm thick samples, few lines in the perpendicular direction also exist. Irregular and faint lines are seen in the 60 nm thick sample also. The density of these lines decrease as the thickness is increased. These are generally referred as cross-hatch patterns due to the pile-up of dislocations at the interface. The surface mass transport observed in the figures would also contribute to the morphology of the irradiated samples. The irradiated samples show better surface morphology which is consistent with Raman results, where different relaxation regimes and different effects are observed at the surface and interface due to irradiation. Fig 3 3µm x 3µm AFM of 36nm thick (a) Unirradiated and (b) Irradiated Sample.
Fig.4 3µm x 3µm AFM of 60nm thick (a) Unirradiated and (b) Irradiated Sample.
Fig.5 3µm x 3µm AFM of 96nm thick (a) Unirradiated and (b) Irradiated Sample.
RBS/C:
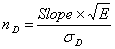
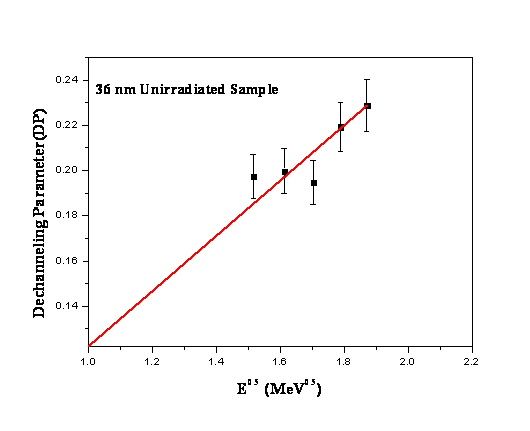
In the present study cD was obtained from the experimental RBS spectra from the GaAs buffer layer (i.e. below the interface) and cv was calculated to be 3.12%. DP Versus E0.5 plot with linear fit and its slope was used for the calculation of dislocation density,
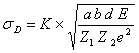
Where sD is given by
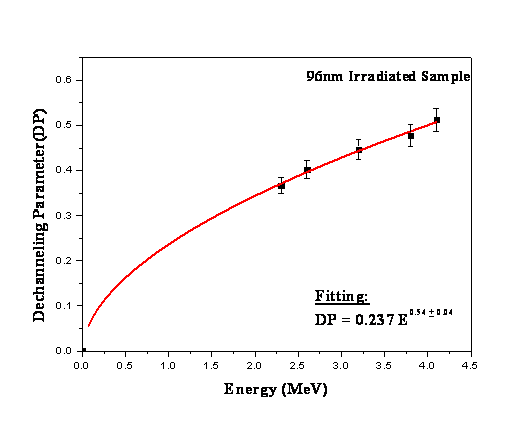
K is constant = 0.471, a is Thomas Fermi screening radius = 0.127366 Å, b is the burger vector @ 4 Å. Table.2 shows the sample details and the calculated parameters. The dechanneling parameter plotted as a function of incident ion energy. The known dechanneling behavior from defects the E0.5 dependence of the DP is attributed to the dislocations present at the interface. the Indium signal and the step observed about the depth close to the interface (Channel. No: 595), which is due to the dislocations present close to the interface. Fig.6 shows the dechanneling parameter and its energy dependence of 96nmI sample, the power fit confirms the E0.5 behavior. Fig.7 shows the DP as a function of E0.5 of 36nmU. The slope of DP Versus E0.5 plot was used for the calculation of dislocation density in the above Eq. Table.2 shows the reduction in dislocation density after irradiation in these samples and the reduction of dislocation density is measurable within the experimental errors. It is widely accepted in the scientific community that ion beam irradiation results in the formation of an intermediate layer. Due to irradiation in InGaAs/GaAs system an intermediate layer of less indium content is expected to be formed which might act as a graded buffer for the InGaAs layer. Formation of such a buffer layer with less indium content may reduce the dislocation density. This would probably be the mechanism for the reduction in dislocation density. Formation of intermediate layer (InxGa1-xAs/InyGa1-yAs/GaAs, where y<x) is supported by experimental RBS spectra along with Gisa3 fittings, the broadening and reduction in the yield of the indium signal (peak) indicates the diffusion of indium into the substrate, due to limited resolution buffer layer is not clearly seen in the spectra. The spectra are simulated assuming a single layer with indium composition x=0.18 in the as grown and x=0.15 in the irradiated sample. An additional peak observed close to the substrate peak in HRXRD scans of irradiated samples is attributed to the distinct lattice parameter regions in the sample. A layer with less indium content possessing lattice parameter between the substrate and the layer would give rise to an additional satellite peak. Raman spectroscopy shows a reduction in amplitude and area of the GaAs type LO mode, which is generally attributed to the diffusion of indium across the interface resulting in an apparent thinning of the layer.The cmin values reported in Table-2 shows irradiated samples have better crystalline quality. Further TEM experiments are in process to confirm the mechanism for the reduction in dislocation density. Table.2: InGaAs/GaAs (001) sample details and calculated parameters.
# Sample Ids in text with U & I refers to unirradiated and irradiated.
Fig.6: Energy dependence of DP for 96nmI Sample.
Fig.7: DP Vs E0.5 for 36nmU sample data points with linear fit.
|
||||||||||||||||||||||||||||||||||||||||||||||||||||||||||||||||||||