|
Lattice Matched System Ion beam mixing experiments have been performed to introduce strain in an initially lattice matched (P523) multilayer system. HRXRD has been employed to study these mixing effects. This experiment is a part of our series of experiments to study ion beam based methods to measure and engineer the bandgap/strain of III-V compound semiconductor multilayers for the integration of optoelectronic circuits. we studied the low fluence sample ( i.e P523 & P523I) using RBS/Channeling measurements. RBS spectra showed ion beam induced inter diffusion of In, Ga, As & P across the interfaces and RBS/C showed that the irradiation can induce finite tensile strain. Good reduction in RBS/C spectra of irradiated sample indicates that the sample structure was not spoiled by irradiation. However we could not determine the exact value of strains in that experiment. Here these values are measured very accurately using HRXRD. Effects of annealing (RTA) have also been studied here.
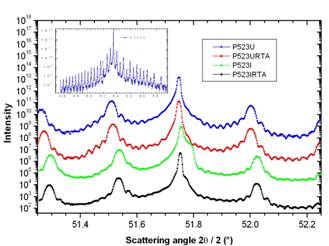
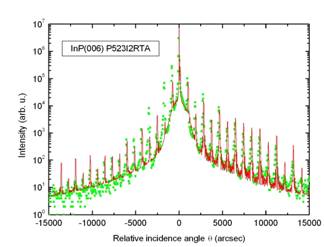
Fig. 1 shows the HRXRD spectra of low dose samples. These spectra are displaced (Shifted upwards) on the intensity axis for clarity. The inset shows the complete interference pattern of P523U. Similar spectrum of P523I2RTA is shown in fig. 2. Very high number of satellite orders in the HRXRD spectra shown in these figures, indicate that the interfaces are very sharp and the boundaries are almost rectangular in shape. Also indicated fact is that these interfaces remain considerably sharp even after irradiation. Broadening in the substrate peak is due to the implantation damage in the substrate region (about 13µ deep), which could be annealed out up to an extent by RTA. Otherwise the basic structure of the lattice is invariant under irradiation and annealing process. The reduction in the intensity of satellite peaks shows the interdiffusion of elements across the interfaces. Superlattice period and strain values are obtained using the simple HRXRD formulae based on Bragg’s law. Measured strain values are given in table 1 which shows the dependence of strain on the ion fluence. For a detailed understanding we have analyzed the HRXRD data of high dose samples using a computer code RADS Mercury. Fig. 2 shows the HRXRD spectra of P523I2RTA along with proper fit as an example. This analysis suggests that the diffusion process will form a thin InxGa1-xAsyP1-y on the top of every layer. This effect is observed even in the pristine sample but the effect is more in irradiated and/or annealed samples. Table 2 shows structure of the sample which is obtained by fittings and table 3 shows the thickness of each layer. The mixing effects are more prominent for ion beam processed (high fluence) and annealed sample as expected. Simple irradiation changes the strain but the interface quality could be improved after annealing as it can be observed by the asymmetry in the substrate peak. However annealing alone doesn't change the strain value significantly. Hence It is shown that the irradiation can induce a tensile strain in an initially lattice matched system with out much loss of the crystalline/interface quality of the samples. Table 1: Measured strain and thickness values
Table 2 Structure details of the superlattice found from HRXRD (Composition)
Table 3: Structure details of the superlattice found from HRXRD (Thickness)
Fig 1: HRXRD spectra of low dose samples zoomed around the substrate peak, maintaining the order given in label box; inset: complete interference pattern of P523U.
Fig 2: HRXRD spectrum with fit of P523I2RTA
|
|||||||||||||||||||||||||||||||||||||||||||||||||||||||||||||||||||||||||||||||||||||||||||||||||||||