|
Design and development of LAPSDT with Dr S V S Nageshwara Rao
A Large Area two dimensional Position Sensitive Del E-E Detector Telescope (LAPSDT) has been designed, fabricated and utilized for several experiments at NSC, New Delhi. This detector is basically a gas ionization chamber with telescopic features and two-dimensional position sensitivity. It is mainly intended to detect heavy recoils in high energy ERDA experiments. Large solid angle is chosen so as to minimize the detection time which in turn will reduce any possible radiation damage during the measurement. The conseqent kinematic broadening (due to large detector acceptance) has been taken care by recording the position information.
This detector has been designed keeping the constantly increasing demand for gaseous detectors in heavy ion physics, especially for detecting heavy recoils. Semiconductor detectors show good performance but they are expensive. Most importantly, they are often spoiled in heavy ion detection and produce unreliable results due to various problems like pulse height effects. Another advantage with gas filled detectors is that the effective length of a gas detector can be tuned accordingly during the operation just by simply changing the gas pressure which is not possible in any other type of detectors. This feature is important in the multi anode telescopic detectors which are capable of detecting both high and low mass elements simultaneously. Hence gas filled detectors are most suitable for this purpose and many laboratories involved in such research, have also optesimilar detector systems.
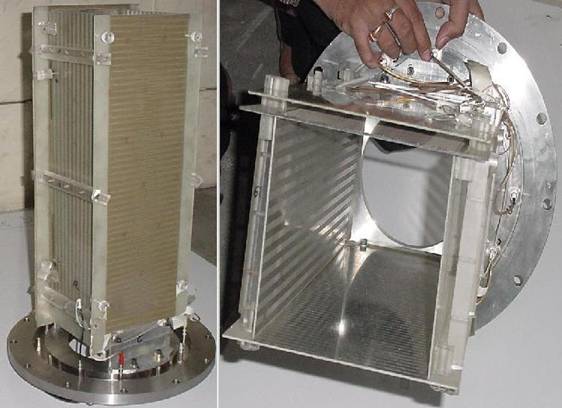
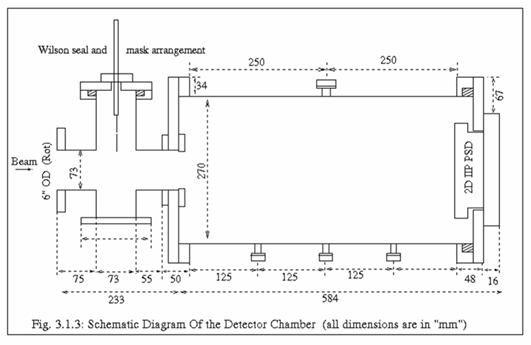
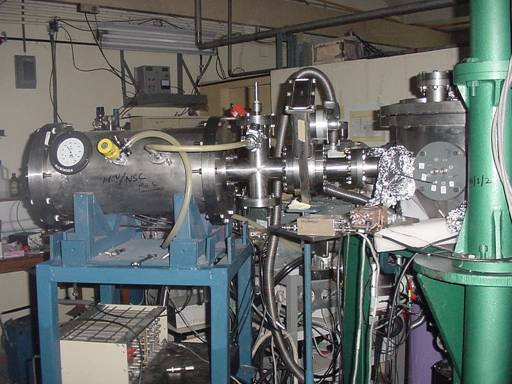
1. Design and Fabrication This detector has been designed to detect up to the lightest semiconductor (B) of highest possible recoil energy (30 MeV) at NSC without using any semiconductor detector. Hence the plate (anode and cathode) length is estimated to stop 30 MeV B within isobutane gas of reasonable pressure i.e 80mb. Calculated dimensions of all plates and detector chamber are given in table 1. These values are determined by considering the fact that the beam entering the detector through the cone defined by the solid angle should always be confined within the plates. Nickel coated Copper plated Glass Epoxy PCB board has been used with standard etching techniques to make the above mentioned plates. Anode is divided into three parts (ΔE1 = 80mm, ΔE2 = 160mm and ΔE3 = 230mm) to get ΔE and E signals. Any two anodes can be combined to form E or ΔE signal depending on the energy and pressure. The cathode is divided into two equal parts (CL & CR) in Backgammon shape to get the position signal (X=[CL-CR]/[CL+CR]). Hence the kinematic spread (dE/E = - 2 tanΦ dΦ) due to large acceptance can be taken care by calculating dΦ from the position signal. Later on this Backgammon structure has been shifted to anode i.e ΔE2 because cathode signals are often noisy and also because generally position signals are weak. Moreover it lifts the Y-dependence on the X-coordinate. The Y position is generally given by (CL+CR)/Etotal. Potential gradient plates are mounted between the grid and cathode on both sides so as to improve the field homogeneity. Thirteen 5mm wide and 470mm long Ni coated Cu strips separated from each other by 5mm etched portions, are connected by 10M resistors in series to from a potential gradient network between cathode and grid. This potential gradient improves the 2D patterns obtained using ΔE2 Backgammon, which otherwise is to be corrected by software as done in other labs. Figure.1 shows the images of the inner-structure (viewed from different angles) and figure 2&3 show the schematic diagram and an image of the detector chamber. Intermediate chamber has been made using the “Cross” such that a mask/source can be inserted for calibration during the experiment without breaking the vacuum.
Table 1: dimensions of detector plates and chamber.
Fig. 1 : Inner structure of the LAPSDT (two views)
Fig. 2: Schematic diagram of the LAPSDT
Fig. 3: Image of the LAPSDT mounted on Goniometer Chamber.
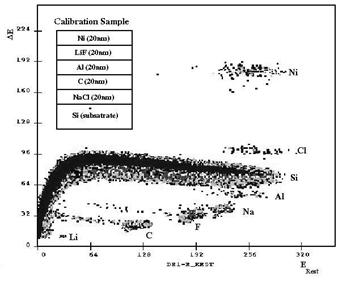
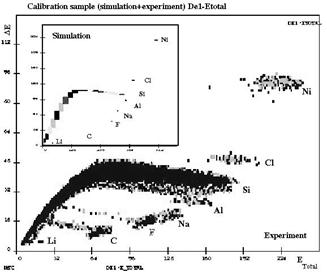
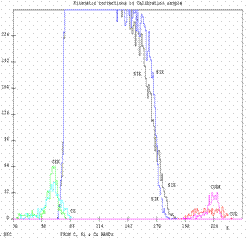
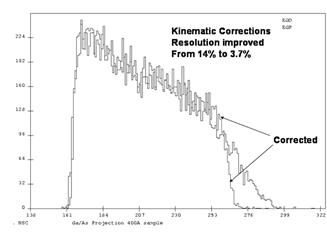
Performance of LAPSDT Energetic Ag ions delivered from 15MV Pelletron accelerator at NSC has been used to perform LAPSDT based ERDA experiments at NSC. Here we present some of these recent results to show the detector performance. These experiments have been performed using 200 MeV Ag with a recoil angle of 55o in Goniometer chamber with the Backgammon structure on the ΔE2 anode. Z-identification Fig.4. shows measured ΔE-Erest and ΔE – Etotal spectra on the calibration sample. The inset of the figure.4 shows the structure of the calibration sample prepared for the LAPSDT based ERDA experiments. This sample was grown by electron gun evaporation technique in the high vacuum chamber at the target laboratory of NSC. Elements in the different layers were chosen so as to have reference ΔE-E bands in different mass regions (From Li to Ni). The inset of the fig.5 shows the simulation spectra obtained from SERDA program for the same experimental conditions. Clear separation between different constituent elements could be observed from these spectra and bands are in agreement with the simulation spectra shown in the inset. Kinematic corrections Here we show the utilization of the position information for kinematic corrections that have been performed for the first time in India. Example 1 (Calibration sample): Fig. 6 shows the projections of three different bands (corrected and uncorrected Cu, Si & c ) on the Etotal axis. These results confirm the improvements in the separation of bands / depth resolution obtained after implementing the kinematic corrections. Example 2 InGaAs/GaAs sample: This is a single In0.1Ga0.9As (400Ao) layer grown in GaAs substrate. Ga and As bands could not be separated because these elements are coming from depth also. “In” band could be separated in ΔE1- Etotal Fig.7 shows the projection of Ga/As band on Etotal axis. The depth resolution has been improved to 3.4% from 14% after implementing the kinematic corrections. Fig. 4: ΔE1 – Erest spectrum obtained from Calibration sample (inset – sample structure).
Fig 5: ΔE1 – Etotal of the same sample.
Fig. 6: Projections of corrected and un corrected (CE & CK), Cu (CUE & CUK) and Si (SIE & SIK) bands obtained from Calibration sample.(axes X: Etotal, Y: Yiled). Fig. 7: Projection of Ga/As like band on to the Energy axis with and without kinematic corrections.
|
||||||||||||||||||||||