|
Development of automated high energy channeling facility at NSC with Dr S V S Nageshwara Rao
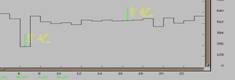
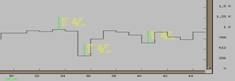
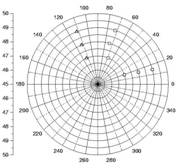
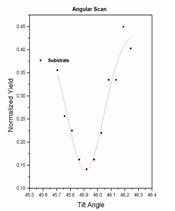
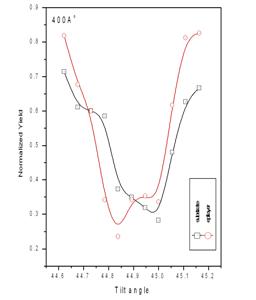
1. Design & Development An automated high energy channeling facility has been developed at Nuclear Science Center, New Delhi, using the existing goniometer (HV). A sample holder has been made using G10 with spring ball locking system. The goniometer sample ladder has six degrees of freedom of which three are translational and the other three are rotational (R1, R2 & tilt). The axis of rotation of R1 (360o, with step 0.018o) is in the vertical plane and is perpendicular to scattering plane while that of R2 (200o, with step 0.0125o) is parallel to beam direction. The axis of rotation of tilt (7o, with step 0.001o) lies in the scattering plane and is perpendicular to beam directions. All these rotations can be controlled remotely using the stepper motor controls provided with the goniometer. Suitable software and hardware have been developed to control this precision goniometer using the CAMAC based data acquisition system. Compatible software routines are written in C++ to integrate the existing data acquisition system (Freedom) with the goniometer control. A CAMAC module has been designed and installed to instruct the stepper motor controls through data acquisition system. Any or all of the rotors can be initialized to their lower limits using the “Initialize” command. At a given time only one rotor can be operated while the other two can be initialized if required. Every time, the active rotor will first be initialized to its lower limit and then it will reach to the specified initial value. This method is used to avoid the possible backlash and also to keep the reference of rotor position during the power failure. Once initialized, the rotor will reach the final value in a given number of steps. Required spectra will be collected at each angle (step) for a given amount of time. At every interval the incident current will also be recorded using a CAMAC based Scalar module which is normally inputted by a digital current integrator. The program will also draw the online normalized angular scan corresponding to a given energy window. However the normalization is only optional. The program is user friendly and all inputs can be fed through popup windows. All the data can be saved event by event in list mode configuration. Offline routines have also been developed to obtain the angular scans from different energy windows depending on the requirements. We have followed the standard polar chart method to locate the required axis. Fig. 1a shows some Φ scans recorded while searching for planar dips as a part of alignment process. Fig. 1b shows a polar chart used for mapping the axis and Fig. 1c shows a sample angular scan obtained from the substrate of the one of the samples.
Fig. 1(a): Sample Φ scans obtained using automation program
Fig. 1(b): A polar chart obtained to locate the axis.
Fig. 1(c): Angular scan obtained from substrate of 100Ao sample
2. Performance of the facility
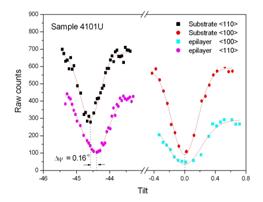
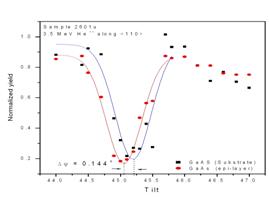
Fig.2 shows the channeling angular scans measured along the off-normal axial direction of 4101 at NSC. A clear angular shift in the <110> angular dip obtained from the epi-layer is observed when compared to that of the substrate. Reasonably good reduction in the channeled yield has been observed from this data. It indicates the good crystalline quality of the samples on one hand and the performance of the automated high energy channeling facility on the other hand. Fig.3 shows the similar scans measured at Alabama on the same sample. Corresponding strain values are in table 1. Although the angular shift is same in both the experiments the shift is clearer in fig.2 when compared to that of fig.3. It is because of two reasons: one is obviously the small critical angle and the other is the good resolution of goniometer and the efficiency of the automation program. Similarly fig.4 shows the channeling angular scans measured around the off-normal axis of 2601. This experiment is performed using the 3.5 MeV He ions delivered from the Pelletron accelerator of IOPB. Considerably good reduction in the channeled yield can be observed in this data also. Measured strain value is given in table 2 along with the result of high energy channeling experiment performed at NSC. In this case the sample has been exposed to radiation for considerably long time during the alignment process and hence the measured strain value is less than that of the low energy result. In this connection it is to note that the channeling measurements have been performed on fresh spot in the case of 4101.
Table 1: Sample specifications and measured strain values.
Fig. 2: Channeling angular scans around the <110> axis of 4101 obtained using the automated high energy channeling facility at NSC (Beam: 40 MeV Si).
Fig. 3 (i) Channeling angular scans measured around both the normal (<100>) and off-normal (<110>) axial directions of 4101U at Alabama. (ii)Angular scans measured around the off-normal axis of 2601 at IOPB.
|
|||||||||||||||